


On February 1, 2019, KO stock (Coca-Cola) was trading at $48.70 per share. If you put $100,000 in that stock, it would be worth $122,790 on January 31, 2024, when the stock price closed at $59.49. Not only that, but over the last 5 years you would have earned $18,680 in dividends.
Taking into account the rise in share value and earnings paid, the $100,000 you put into 2,052 shares is now worth $141,470, which is a 7.2% annualized return over the 5 years.
Coca-Cola (KO Stock) has always been known for paying dividends on time, and the last 5 years have been no different. The dividend has been raised by the company for 58 years in a row, making it a Dividend King with one of the longest streaks of yearly dividend increases.
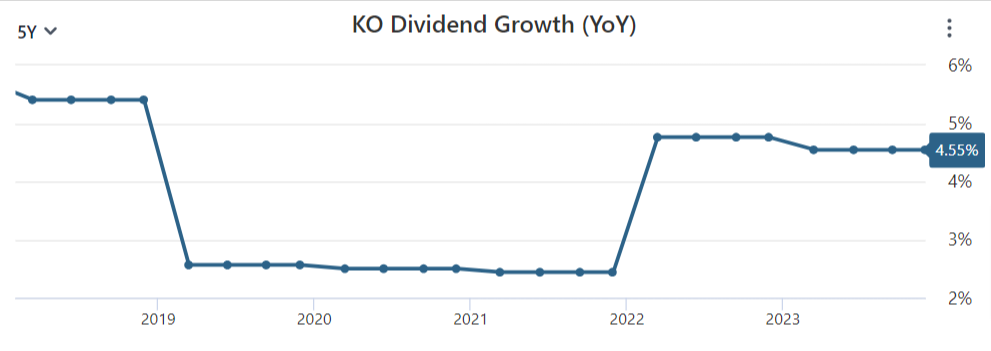
KO Stock has raised its quarterly payment per share from $0.40 to $0.46 over the course of the five-year investment period. This is a 14% increase in total growth or 4.55% annualized. Along with the stock’s capital growth, this steady dividend growth has created a stream of rising income.

Coke paid $1.60 in payments per share in 2019, the year the initial investment was made. After a few years, in 2023, the dividend was $1.84 per share. This means that the value of the 2,052 shares bought with the $100,000 investment will go up from $3,283 in 2019 to $3,776 in 2023.
Over the years, Coca-Cola has raised its bonus every year, and it can do so again in the years to come. That is, only 74.2% of its gains were paid out as dividends in 2022, which is a very low percentage. Most of the time, a payout ratio below 80% is good for a stable consumer staples company like Coca-Cola.
The company also has a lot of free cash flow, which helps pay the bonus. Coca-Cola (KO Stock) had $9.6 billion in free cash flow in 2022, which means that 65% of its free cash flow was paid out as dividends.
So, an investor who bought this stock five years ago would have made a nice annual yield of about three percent. Now, thanks to the dividend increases, that yield on cost has gone up to 3% by 2024.
Overall, Coca-Cola (KO Stock) has been a good investment over the last 5 years. Its rising income and steady share price gains have given investors a respectable 7%+ annual return during one of the best times ever for the S&P 500.
Even better would have been for an investor who put those profits back into the business along the way.
Even though it wasn’t the most exciting purchase, Coca-Cola won in the end. The company has strong brands, long-lasting competitive benefits, and a promise to return cash to shareholders. The next 5 years also look good.


The Coca-Cola Company Dividend Information
- Dividend Yield: 3.09%
- Annual Dividend: $1.84
- Ex-Dividend Date: Nov 30, 2023
- Payout Frequency: Quarterly
- Payout Ratio: 74.19%
- Dividend Growth: 4.55%
Dividend History of Last 5 Years
| Ex-Dividend Date | Cash Amount | Record Date | Pay Date |
| Nov 30, 2023 | $0.460 | Dec 1, 2023 | Dec 15, 2023 |
| Sep 14, 2023 | $0.460 | Sep 15, 2023 | Oct 2, 2023 |
| Jun 15, 2023 | $0.460 | Jun 16, 2023 | Jul 3, 2023 |
| Mar 16, 2023 | $0.460 | Mar 17, 2023 | Apr 3, 2023 |
| Nov 30, 2022 | $0.440 | Dec 1, 2022 | Dec 15, 2022 |
| Sep 15, 2022 | $0.440 | Sep 16, 2022 | Oct 3, 2022 |
| Jun 14, 2022 | $0.440 | Jun 15, 2022 | Jul 1, 2022 |
| Mar 14, 2022 | $0.440 | Mar 15, 2022 | Apr 1, 2022 |
| Nov 30, 2021 | $0.420 | Dec 1, 2021 | Dec 15, 2021 |
| Sep 14, 2021 | $0.420 | Sep 15, 2021 | Oct 1, 2021 |
| Jun 14, 2021 | $0.420 | Jun 15, 2021 | Jul 1, 2021 |
| Mar 12, 2021 | $0.420 | Mar 15, 2021 | Apr 1, 2021 |
| Nov 30, 2020 | $0.410 | Dec 1, 2020 | Dec 15, 2020 |
| Sep 14, 2020 | $0.410 | Sep 15, 2020 | Oct 1, 2020 |
| Jun 12, 2020 | $0.410 | Jun 15, 2020 | Jul 1, 2020 |
| Mar 13, 2020 | $0.410 | Mar 16, 2020 | Apr 1, 2020 |
| Nov 29, 2019 | $0.400 | Dec 2, 2019 | Dec 16, 2019 |
| Sep 13, 2019 | $0.400 | Sep 16, 2019 | Oct 1, 2019 |
| Jun 13, 2019 | $0.400 | Jun 14, 2019 | Jul 1, 2019 |
| Mar 14, 2019 | $0.400 | Mar 15, 2019 | Apr 1, 2019 |
| Nov 29, 2018 | $0.390 | Nov 30, 2018 | Dec 14, 2018 |
Income Statement (Annual)
Financials in millions USD. Fiscal year is January – December
| Year | 2022 | 2021 | 2020 | 2019 | 2018 |
| Revenue | 43,004 | 38,655 | 33,014 | 37,266 | 34,300 |
| Revenue Growth (YoY) | 11.25% | 17.09% | -11.41% | 8.65% | -5.28% |
| Cost of Revenue | 18,000 | 15,357 | 13,433 | 14,619 | 13,067 |
| Gross Profit | 25,004 | 23,298 | 19,581 | 22,647 | 21,233 |
| Selling, General & Admin | 12,880 | 12,144 | 9,731 | 12,103 | 11,002 |
| Other Operating Expenses | 1,215 | 846 | 853 | 458 | 1,079 |
| Operating Expenses | 14,095 | 12,990 | 10,584 | 12,561 | 12,081 |
| Operating Income | 10,909 | 10,308 | 8,997 | 10,086 | 9,152 |
| Interest Expense / Income | 882 | 1,597 | 1,437 | 946 | 950 |
| Other Expense / Income | -1,630 | -3,681 | -2,168 | -1,581 | 19 |
| Pretax Income | 11,657 | 12,392 | 9,728 | 10,721 | 8,183 |
| Income Tax | 2,115 | 2,621 | 1,981 | 1,801 | 1,749 |
| Net Income | 9,542 | 9,771 | 7,747 | 8,920 | 6,434 |
| Net Income Growth | -2.34% | 26.13% | -13.15% | 38.64% | 415.54% |
| Shares Outstanding (Basic) | 4,328 | 4,315 | 4,295 | 4,276 | 4,259 |
| Shares Outstanding (Diluted) | 4,350 | 4,340 | 4,323 | 4,314 | 4,299 |
| Shares Change | 0.23% | 0.39% | 0.21% | 0.35% | -0.58% |
| EPS (Basic) | 2.20 | 2.26 | 1.80 | 2.09 | 1.51 |
| EPS (Diluted) | 2.19 | 2.25 | 1.79 | 2.07 | 1.50 |
| EPS Growth | -2.67% | 25.70% | -13.53% | 38.00% | 417.24% |
| Free Cash Flow | 9,609 | 11,366 | 8,856 | 9,395 | 6,327 |
| Free Cash Flow Per Share | 2.22 | 2.63 | 2.06 | 2.20 | 1.49 |
| Dividend Per Share | 1.760 | 1.680 | 1.640 | 1.600 | 1.560 |
| Dividend Growth | 4.76% | 2.44% | 2.50% | 2.56% | 5.41% |
| Gross Margin | 58.14% | 60.27% | 59.31% | 60.77% | 61.90% |
| Operating Margin | 25.37% | 26.67% | 27.25% | 27.06% | 26.68% |
| Profit Margin | 22.19% | 25.28% | 23.47% | 23.94% | 18.76% |
| Free Cash Flow Margin | 22.34% | 29.40% | 26.82% | 25.21% | 18.45% |
| Effective Tax Rate | 18.14% | 21.15% | 20.36% | 16.80% | 21.37% |
| EBITDA | 13,799 | 15,441 | 12,701 | 13,032 | 10,219 |
| EBITDA Margin | 32.09% | 39.95% | 38.47% | 34.97% | 29.79% |
| Depreciation & Amortization | 1,260 | 1,452 | 1,536 | 1,365 | 1,086 |
| EBIT | 12,539 | 13,989 | 11,165 | 11,667 | 9,133 |
| EBIT Margin | 29.16% | 36.19% | 33.82% | 31.31% | 26.63% |