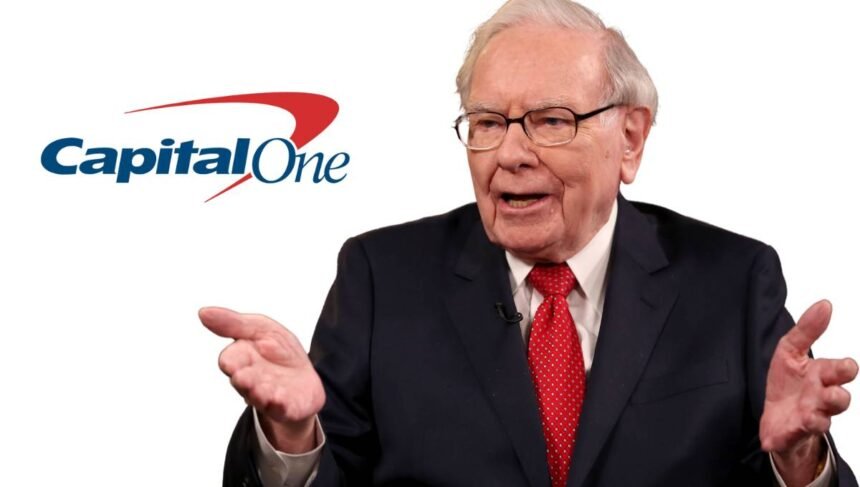
Warren Buffett, the famous Omaha investor, is putting a lot of money into Capital One Financial (NYSE: COF), a financial services company, because he thinks the economy will get better in 2024. Buffett has built up a holding in Capital One worth more than $1.6 billion through Berkshire Hathaway going into the new year.
Berkshire bought about 9.9 million shares in the first quarter of 2023 and another 2.55 million shares in the second quarter[mfn]Stone, B. (2023, May 16). Berkshire Hathaway’s First Quarter 2023 Portfolio Moves. Forbes. https://www.forbes.com/sites/bill_stone/2023/05/16/berkshire-hathaways-first-quarter-2023-portfolio-moves/[/mfn]. This shows that Buffett is looking for cheap cyclical companies in the usual way.
Like his big bet on Bank of America after the Great Recession, the Capital One bet is on the economy getting better in 2024 and beyond.
Credit Cards and Loans Driving Near-Term Growth
Capital One has $144 billion in credit card payments as of September 2023. The company is best known for its credit cards. $137.5 billion comes from loans in the United States. As worries about a recession fade and Americans continue to spend their funds in 2023, lending has sped up into the new year.
Credit card companies like Capital One are set to do well in 2024 because GDP growth is expected to stay small and interest rates on prime loans are expected to stay low. This was said by Nick Clements, co-founder of MagnifyMoney.com and an expert on credit.
Capital One relies on subprime borrowers, which means that its stock has a higher credit risk than that of its peers. When the economy gets worse, these people are usually the first to stop paying.
“While write-offs may uptick in a recessionary environment, Capital One’s balance sheet and loss provisions remain healthy after strengthening considerably since the Great Recession,” Clements said. “They have plenty of experience managing risk across credit cycles at this point.”
Attractive Valuation Mirrors Bank of America Play
Along with good loan cycle trends, Buffett also timed his Capital One buy based on the company’s value. Right now, shares move close to their book value, and the forward price-to-earnings ratio is less than 10.
The value profile looks a lot like Berkshire’s buy of Bank of America after the recession, when the stock was highly discounted. In 2011, Berkshire put $5 billion into the failing bank, which let it buy shares for just 0.5 times their book value.
Berkshire now owns more than 1 billion BofA shares, which are worth more than $40 billion. This is a huge profit for the company.
Capital One now has a similar value proposition in financials, even though it was less troubled when the deal was made. And Buffett is betting another $1 billion that the pick will pay off big if the economy keeps getting better.
Weakening Economic Data Adds Risk in 2024
The biggest threat to Buffett’s Capital One theory is that the economy might get worse in 2024. Even though consumers are still pretty healthy after the huge pandemic stimulus, the economy has been getting worse as 2023 ends.
One important change is that by December, M2 money supply growth had slowed to just 2%. That’s a big drop from the 12% that it was for most of 2022. It usually takes 9 to 12 months for the economy to shrink after supply growth slows.
Even scarier, the yield curve turned around again in the fourth quarter of 2023. Inversion has been a strong sign of recession in the past. It means that monetary tightening has gone too far without enough economic growth to support higher rates.
“While the Fed stopped short of outright cutting rates in late 2023, quantitative tightening continues to deflate the massive balance sheet expansion during coronavirus crisis stimulus,” Nathan McDonald, an expert on money supply, said. “That risks REAL economic pain ahead if the Fed isn’t nimble enough in its response.”[mfn]https://www.sprottmoney.ca/blog/the-great-fiat-money-experiment-helicopter-money-goes-global-nathan-mcdonald-april-9-2020[/mfn]
In short, the U.S. economy might not be completely fine yet. For a company like Capital One that deals with a lot of subprime loans, an unexpected downturn in 2024 would almost certainly hurt consumer credit and make it harder to make money from loans.
Buffett Betting on Eventual Post-Pandemic Normalize
Even if the U.S. goes into recession in 2024, the most famous value investor in the world clearly thinks that Capital One will do better in the long run after the pandemic. After 2008, Buffett put a lot of money into BofA using the same reasoning.
The stock picks made by Todd Combs and Ted Weschler, who are both in their 90s, are going to be more important to Berkshire now. But after years of working with Buffett, they know all of his moves inside and out.
That means slowly buying up shares of good companies that are selling for a lot less than their true value. Then they waited for profits to rise and multiples to grow during the next rebound.
This is a plan that has worked very well for Berkshire Hathaway for many years. Even though there are more risks with financial stocks now, Buffett’s billion-dollar bet shows that he is sure that his tried-and-true value method can once again beat the market.
Capital One Financial (NYSE: COF) Income Statement of Last 5 Year (Annual)
| Year | 2022 | 2021 | 2020 | 2019 | 2018 |
|---|---|---|---|---|---|
| Revenue | 28,403 | 32,379 | 18,259 | 22,357 | 22,220 |
| Revenue Growth (YoY) | -12.28% | 77.33% | -18.33% | 0.62% | 12.87% |
| Gross Profit | 28,403 | 32,379 | 18,259 | 22,357 | 22,220 |
| Selling, General & Admin | 17,678 | 14,997 | 13,060 | 13,287 | 12,424 |
| Other Operating Expenses | 1,485 | 1,573 | 1,996 | 2,196 | 2,478 |
| Operating Expenses | 19,163 | 16,570 | 15,056 | 15,483 | 14,902 |
| Operating Income | 9,240 | 15,809 | 3,203 | 6,874 | 7,318 |
| Other Expense / Income | – | 4 | 3 | -13 | 10 |
| Pretax Income | 9,240 | 15,805 | 3,200 | 6,887 | 7,308 |
| Income Tax | 1,880 | 3,415 | 486 | 1,341 | 1,293 |
| Net Income | 7,360 | 12,390 | 2,714 | 5,546 | 6,015 |
| Preferred Dividends | 316 | 425 | 339 | 354 | 305 |
| Net Income Common | 7,044 | 11,965 | 2,375 | 5,192 | 5,710 |
| Net Income Growth | -41.13% | 403.79% | -54.26% | -9.07% | 235.09% |
| Shares Outstanding (Basic) | 382 | 426 | 457 | 466 | 474 |
| Shares Change | -10.32% | -6.95% | -1.79% | -1.68% | -2.29% |
| EPS (Basic) | 17.98 | 27.04 | 5.19 | 11.10 | 11.90 |
| EPS (Diluted) | 17.91 | 26.94 | 5.18 | 11.05 | 11.82 |
| EPS Growth | -33.52% | 420.08% | -53.12% | -6.51% | 238.68% |
| Free Cash Flow | 12,875 | 11,612 | 15,989 | 15,752 | 12,104 |
| Free Cash Flow Per Share | 33.73 | 27.28 | 34.96 | 33.82 | 25.55 |
| Dividend Per Share | 2.400 | 2.000 | 1.000 | 1.600 | 1.600 |
| Dividend Growth | 20.00% | 100.00% | -37.50% | 0% | 0% |
| Gross Margin | 100.00% | 100.00% | 100.00% | 100.00% | 100.00% |
| Operating Margin | 32.53% | 48.82% | 17.54% | 30.75% | 32.93% |
| Profit Margin | 24.80% | 36.95% | 13.01% | 23.22% | 25.70% |
| Free Cash Flow Margin | 45.33% | 35.86% | 87.57% | 70.46% | 54.47% |
| Effective Tax Rate | 20.35% | 21.61% | 15.19% | 19.47% | 17.69% |
| EBITDA | 12,450 | 19,286 | 6,701 | 10,226 | 9,704 |
| EBITDA Margin | 43.83% | 59.56% | 36.70% | 45.74% | 43.67% |
| Depreciation & Amortization | 3,210 | 3,481 | 3,501 | 3,339 | 2,396 |
| EBIT | 9,240 | 15,805 | 3,200 | 6,887 | 7,308 |
| EBIT Margin | 32.53% | 48.81% | 17.53% | 30.80% | 32.89% |
Capital One Financial (NYSE: COF) Balance Sheet of Last 5 Year (Annual)
| Year | 2022 | 2021 | 2020 | 2019 | 2018 |
|---|---|---|---|---|---|
| Cash & Equivalents | 30,856 | 21,746 | 40,509 | 13,407 | 13,186 |
| Cash & Cash Equivalents | 30,856 | 21,746 | 40,509 | 13,407 | 13,186 |
| Cash Growth | 41.89% | -46.32% | 202.15% | 1.68% | -6.08% |
| Property, Plant & Equipment | 4,351 | 4,210 | 4,287 | 4,378 | 4,191 |
| Goodwill and Intangibles | 14,777 | 14,782 | 14,653 | 14,653 | 14,544 |
| Total Assets | 455,249 | 432,381 | 421,602 | 390,365 | 372,538 |
| Total Liabilities | 402,667 | 371,352 | 361,398 | 332,354 | 320,870 |
| Total Debt | 48,715 | 43,086 | 40,539 | 55,697 | 58,905 |
| Debt Growth | 13.06% | 6.28% | -27.22% | -5.45% | -2.28% |
| Common Stock | 5,314 | 9,649 | 16,622 | 16,515 | 17,056 |
| Retained Earnings | 57,184 | 51,006 | 40,088 | 40,340 | 35,875 |
| Comprehensive Income | -9,916 | 374 | 3,494 | 1,156 | -1,263 |
| Shareholders’ Equity | 52,582 | 61,029 | 60,204 | 58,011 | 51,668 |
| Net Cash / Debt | -17,859 | -21,340 | -30 | -42,290 | -45,719 |
| Book Value Per Share | 137.76 | 143.39 | 131.62 | 124.56 | 109.08 |
Capital One Financial (NYSE: COF) Cash Flow of Last 5 Year (Annual)
| Year | 2022 | 2021 | 2020 | 2019 | 2018 |
|---|---|---|---|---|---|
| Net Income | 7,044 | 11,965 | 2,375 | 5,192 | 5,710 |
| Depreciation & Amortization | 3,210 | 3,481 | 3,501 | 3,339 | 2,396 |
| Share-Based Compensation | 314 | 331 | 203 | 239 | 170 |
| Other Operating Activities | 2,925 | -3,892 | 10,281 | 7,515 | 4,397 |
| Operating Cash Flow | 13,809 | 12,310 | 16,699 | 16,639 | 12,978 |
| Operating Cash Flow Growth | 12.18% | -26.28% | 0.36% | 28.21% | -8.49% |
| Capital Expenditures | -934 | -698 | -710 | -887 | -874 |
| Acquisitions | -1,176 | -669 | -7 | -8,393 | -600 |
| Change in Investments | -19,412 | -22,849 | -5,898 | -4,730 | -7,403 |
| Other Investing Activities | -8,216 | -7,285 | -8,226 | -8,988 | -6,741 |
| Investing Cash Flow | -29,738 | -31,501 | -14,841 | -22,998 | -15,618 |
| Dividends Paid | -1,178 | -1,422 | -740 | -1,035 | -1,038 |
| Share Issuance / Repurchase | -4,653 | -7,297 | -90 | -1,265 | -2,071 |
| Debt Issued / Paid | 8,423 | 3,554 | -16,480 | -4,186 | -1,191 |
| Other Financing Activities | 22,539 | 5,639 | 42,474 | 13,105 | 6,077 |
| Financing Cash Flow | 25,131 | 474 | 25,164 | 6,619 | 1,777 |
| Net Cash Flow | 9,202 | -18,717 | 27,022 | 260 | -863 |
| Free Cash Flow | 12,875 | 11,612 | 15,989 | 15,752 | 12,104 |
| Free Cash Flow Growth | 10.88% | -27.38% | 1.50% | 30.14% | -8.05% |
| Free Cash Flow Margin | 45.33% | 35.86% | 87.57% | 70.46% | 54.47% |
| Free Cash Flow Per Share | 33.73 | 27.28 | 34.96 | 33.82 | 25.55 |


