


EOSE stock price has decreased by 76.60% in the past 6 months, closing at 0.94 USD on January 5, 2024.
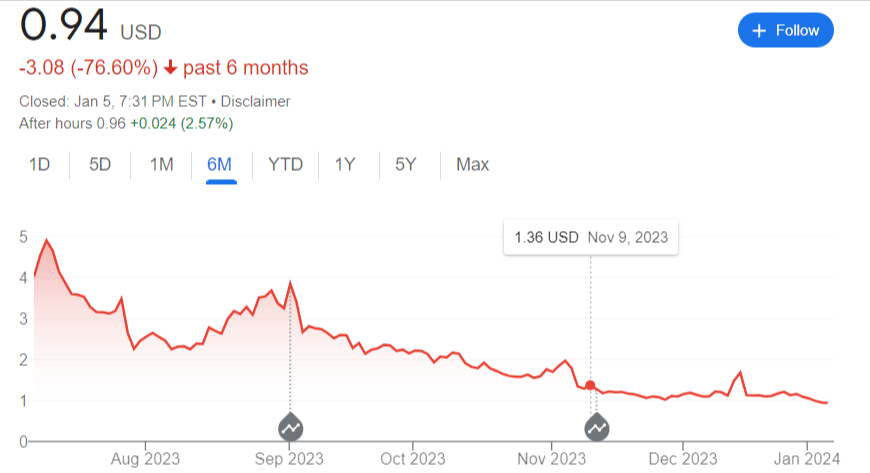
Eos Energy Enterprises Inc’s (EOSE) stock price decline over the past 6 months can be attributed to several factors. The company’s unprofitability, recent revenue losses, and a significant increase in outstanding shares have impacted its stock performance.
Additionally, the market sentiment towards the company has been negative, reflecting challenges in the energy sector and the company’s path to consistent profitability.
Eos Energy Enterprises has also disclosed various risk factors, including finance and corporate-related risks, which may have influenced investor confidence. These combined factors have likely contributed to the decline in the company’s stock price.
How is the Energy Sector Doing in the Stock Market?
Recently, the stock market has been all over the place for the energy business. High prices for oil and natural gas led to a lot of growth in the sector in 2022, which was good for stocks in the energy sector.
But the sector has had problems in 2023. Price changes have been caused by things like a lack of supply, rising demand, and political unrest. There have been some ups and downs in the S&P 500 Energy Sector Index over the past few months.
Even with these problems, the energy sector is still an important part of the world economy, and investors are keeping a close eye on it for the next few years to see what chances and risks might arise.
What is the Current Market Sentiment Towards EOSE Stock
Analysts have given Eos Energy Enterprises Inc. a Moderate Buy rating, but the market is not optimistic about the company right now. The average price target for the stock is $8, which means that from its present price of $0.94, it could go up by 830.1%.
But Eos Energy Enterprises has been facing big problems, like recent drops in sales and an increase in the number of shares that are outstanding, which have had an effect on the performance of its stock. Even with these problems, the company has made progress in the field of energy storage with Znyth, a revolutionary zinc battery.
Compared to other businesses in the same field, EOSE stock has had a range of results over the past few months. The stock has gone up 72% in the last year, but it has been very volatile and is now selling 77.2% below what it is thought to be worth.
Most of the time, the market is cautious about Eos Energy Enterprises. Before investing, people should think about the company’s long-term prospects and risks.
| Market Cap | 181.15M |
| Revenue (ttm) | 12.43M |
| Net Income (ttm) | -244.91M |
| Shares Out | 192.55M |
| EPS (ttm) | -2.51 |
| PE Ratio | n/a |
| Forward PE | n/a |
| Dividend | n/a |
| Ex-Dividend Date | n/a |
| Volume | 5,723,821 |
| Open | 0.965 |
| Previous Close | 0.950 |
| Day’s Range | 0.922 – 1.010 |
| 52-Week Range | 0.922 – 5.665 |
| Beta | 2.31 |
| Analysts | Buy |
| Price Target | 8.75 (+830.06%) |
| Earnings Date | Feb 27, 2024 |
Income Statement (Quarterly)
Financials in millions USD. Fiscal year is January – December.
| Quarter Ended | 2023-09-30 | 2023-06-30 | 2023-03-31 | 2022-12-31 | 2022-09-30 | 2022-06-30 | 2022-03-31 | 2021-12-31 | 2021-09-30 | 2021-06-30 | 2021-03-31 | 2020-12-31 | 2020-09-30 | 2020-06-30 | 2020-03-31 | 2019-12-31 | 2019-09-30 |
|---|---|---|---|---|---|---|---|---|---|---|---|---|---|---|---|---|---|
| Revenue | 0.68 | 0.25 | 8.84 | 2.67 | 6.07 | 5.9 | 3.3 | 3.1 | 0.72 | 0.61 | 0.16 | 0.18 | 0.04 | 0 | 0 | 0.29 | 0 |
| Revenue Growth (YoY) | -88.72% | -95.78% | 167.89% | -14.11% | 744.71% | 863.24% | 1910.98% | 1586.96% | 1951.43% | – | – | -35.44% | – | – | – | – | – |
| Cost of Revenue | 21.26 | 11.25 | 26.94 | 30.79 | 50.03 | 36.87 | 35.58 | 21.13 | 12.9 | 12.36 | 0.1 | -0.65 | 6.05 | 0.05 | 0.06 | 0.77 | 0 |
| Gross Profit | -20.58 | -11 | -18.11 | -28.13 | -43.96 | -30.97 | -32.28 | -18.02 | -12.19 | -11.75 | 0.06 | 0.84 | -6.02 | -0.05 | -0.06 | -0.48 | 0 |
| Selling, General & Admin | 13.08 | 13.14 | 13.96 | 12.58 | 14.65 | 19.12 | 14.28 | 14.05 | 8.83 | 11.33 | 8.8 | 10.07 | 4.57 | 1.41 | 2.36 | 1.36 | 0 |
| Research & Development | 3.23 | 5.03 | 5.45 | 3.58 | 4.46 | 5.46 | 4.96 | 5.34 | 5.12 | 3.65 | 5.05 | 5.23 | 3.88 | 2.25 | 2.23 | 1.65 | 0 |
| Other Operating Expenses | 0.96 | 5.44 | 0.76 | 4.33 | 0.5 | 1.83 | 0.18 | 0.2 | 0.16 | 22.46 | 7.86 | 0.76 | -0.19 | 0.48 | 0.35 | 1.18 | 0 |
| Operating Expenses | 17.26 | 23.6 | 20.16 | 20.48 | 19.61 | 26.41 | 19.42 | 19.58 | 14.1 | 37.44 | 21.72 | 16.06 | 8.26 | 4.14 | 4.94 | 4.19 | 0 |
| Operating Income | -37.84 | -34.6 | -38.27 | -48.61 | -63.57 | -57.38 | -51.7 | -37.6 | -26.29 | -49.19 | -21.65 | -15.22 | -14.27 | -4.19 | -4.99 | -4.67 | 0 |
| Interest Expense / Income | 9.44 | 19.64 | 18.58 | 7.63 | 5.73 | 2.95 | 2.51 | 1.28 | 3.74 | 0.15 | 0.02 | 0.34 | 16.63 | 3.05 | 3.81 | 18.85 | 0 |
| Other Expense / Income | -62.23 | 77.39 | 14.74 | 0.37 | 1.32 | -3.62 | -8.38 | -8.29 | -11.91 | 4.7 | -0.22 | 9.73 | -0.78 | -1.35 | 0.55 | -4.69 | – |
| Pretax Income | 14.95 | -131.63 | -71.59 | -56.61 | -70.61 | -56.71 | -45.83 | -30.59 | -18.12 | -54.04 | -21.46 | -25.3 | -30.12 | -5.88 | -9.35 | -18.83 | 0 |
| Income Tax | 0.01 | 0 | 0.01 | 0.01 | 0.11 | -0.02 | -0.04 | 0 | 0 | 0 | 0 | 0 | 0 | 0 | 0 | 0 | 0 |
| Net Income | 14.93 | -131.63 | -71.6 | -56.61 | -70.72 | -56.69 | -45.79 | -30.59 | -18.12 | -54.04 | -21.46 | -25.3 | -30.12 | -5.88 | -9.35 | -18.83 | 0 |
| Shares Outstanding (Basic) | 138 | 117 | 87 | 62 | 63 | 56 | 54 | 54 | 54 | 52 | 51 | 9 | 4 | 4 | 4 | 4 | 5 |
| Shares Outstanding (Diluted) | 156 | 117 | 87 | 62 | 63 | 56 | 54 | 54 | 54 | 52 | 51 | 9 | 4 | 4 | 4 | – | 5 |
| Shares Change | 147.88% | 109.42% | 60.85% | 16.20% | 17.58% | 8.16% | 5.54% | 471.10% | 1264.69% | 1217.76% | 1200.83% | 139.39% | -21.39% | – | – | – | – |
| EPS (Basic) | 0.11 | -1.12 | -0.82 | -0.68 | -1.12 | -1.01 | -0.85 | -0.57 | -0.34 | -1.04 | -0.42 | 4.03 | -7.66 | -1.50 | -2.38 | – | – |
| EPS (Diluted) | 0.11 | -1.12 | -0.82 | -0.68 | -1.12 | -1.01 | -0.85 | -0.57 | -0.34 | -1.04 | -0.42 | 4.03 | -7.66 | -1.50 | -2.38 | – | – |
| Free Cash Flow | -43.08 | -52.31 | -33.38 | -39.02 | -79.42 | -50.63 | -47.86 | -39.79 | -35.52 | -42.24 | -14.19 | -17.9 | -9.85 | -0.73 | -1.68 | -3.51 | – |
| Free Cash Flow Per Share | -0.31 | -0.45 | -0.39 | -0.63 | -1.26 | -0.90 | -0.89 | -0.74 | -0.66 | -0.81 | -0.28 | -1.90 | -2.50 | -0.19 | -0.43 | -0.89 | – |
| Gross Margin | -3008.48% | -4416.47% | -204.92% | -1054.99% | -724.81% | -525.38% | -978.74% | -580.61% | -1697.21% | -1920.26% | 39.02% | 454.35% | -17188.57% | – | – | -169.12% | – |
| Operating Margin | -5531.73% | -13894.38% | -433.11% | -1823.29% | -1048.13% | -973.33% | -1567.68% | -1211.31% | -3661.00% | -8037.25% | -13201.83% | -8273.91% | -40782.86% | – | – | -1638.95% | – |
| Profit Margin | 2183.04% | -52863.45% | -810.41% | -2123.52% | -1166.07% | -961.61% | -1388.45% | -985.60% | -2524.23% | -8830.56% | -13082.93% | -13747.28% | -86045.71% | – | – | -6606.32% | – |
| Free Cash Flow Margin | -6298.54% | -21006.83% | -377.76% | -1463.69% | -1309.45% | -858.78% | -1451.30% | -1281.73% | -4947.49% | -6901.14% | -8654.27% | -9730.43% | -28134.29% | – | – | -1232.28% | – |
| Effective Tax Rate | 0.09% | – | – | – | – | – | – | – | – | – | – | – | – | – | – | – | – |
| EBITDA | 26.81 | -109.27 | -50.09 | -45.78 | -63.08 | -52.27 | -42.13 | -28.19 | -13.46 | -53.04 | -20.79 | -24.54 | -13.1 | -2.45 | -5.17 | 0.37 | – |
| EBITDA Margin | 3919.44% | -43883.94% | -566.92% | -1717.29% | -1040.05% | -886.75% | -1277.56% | -908.05% | -1874.79% | -8666.67% | -12677.44% | -13336.41% | -37422.86% | – | – | 131.23% | – |
| Depreciation & Amortization | 2.42 | 2.71 | 2.92 | 3.2 | 1.81 | 1.49 | 1.19 | 1.12 | 0.92 | 0.85 | 0.64 | 0.42 | 0.39 | 0.39 | 0.37 | 0.35 | – |
| EBIT | 24.39 | -111.98 | -53.01 | -48.98 | -64.89 | -53.76 | -43.32 | -29.31 | -14.38 | -53.89 | -21.44 | -24.96 | -13.49 | -2.84 | -5.54 | 0.02 | 0 |
| EBIT Margin | 3565.50% | -44973.49% | -599.95% | -1837.21% | -1069.84% | -911.99% | -1313.55% | -944.27% | -2002.92% | -8805.39% | -13070.12% | -13562.50% | -38542.86% | – | – | 7.37% | – |
Source: Nasdaq Data Link
Balance Sheet (Annual)
| Quarter Ended | 2023-09-30 | 2023-06-30 | 2023-03-31 | 2022-12-31 | 2022-09-30 | 2022-06-30 | 2022-03-31 | 2021-12-31 | 2021-09-30 | 2021-06-30 | 2021-03-31 | 2020-12-31 | 2020-09-30 | 2020-06-30 | 2020-03-31 | 2019-12-31 |
|---|---|---|---|---|---|---|---|---|---|---|---|---|---|---|---|---|
| Cash & Equivalents | 61.41 | 26.61 | 18.85 | 19.8 | 40.32 | 17.53 | 56.62 | 105.69 | 144.72 | 74.69 | 100.72 | 121.85 | 6.53 | 177.26 | 0.01 | 0.86 |
| Short-Term Investments | 0.06 | 0.06 | 0.05 | 0.04 | 0.12 | 0.12 | 0.1 | 0.1 | 0.09 | 0.07 | 0.03 | 0 | 0 | 0 | 0 | 0 |
| Cash & Cash Equivalents | 61.47 | 26.66 | 18.9 | 19.84 | 40.43 | 17.64 | 56.72 | 105.8 | 144.81 | 74.76 | 100.75 | 121.85 | 6.53 | 177.26 | 0.01 | 0.86 |
| Cash Growth | 52.04% | 51.11% | -66.68% | -81.25% | -72.08% | -76.40% | -43.70% | -13.18% | 2116.25% | -57.83% | 676346.89% | 14036.08% | – | – | – | – |
| Receivables | 1.58 | 1.52 | 3.66 | 1.67 | 2.4 | 2.6 | 2.68 | 1.92 | 2.35 | 0.37 | 0.32 | 0 | 0.32 | 0 | 0 | 0.33 |
| Inventory | 20.57 | 16.63 | 14.08 | 23.26 | 23.19 | 12.94 | 10.29 | 12.98 | 5 | 4.43 | 0.09 | 0.21 | 0.08 | 0 | 0 | 0 |
| Other Current Assets | 24.87 | 19.16 | 13.4 | 10.38 | 15.61 | 27.28 | 26.46 | 21.89 | 16.92 | 12.18 | 6.23 | 5.3 | 6.39 | -176.5 | 0 | 4.8 |
| Total Current Assets | 108.49 | 63.97 | 50.03 | 55.15 | 81.64 | 60.46 | 96.15 | 142.57 | 169.08 | 91.74 | 107.39 | 127.37 | 13.32 | 0.75 | 0.01 | 5.98 |
| Property, Plant & Equipment | 24.28 | 23.88 | 28.7 | 31.49 | 34.37 | 25.76 | 19.51 | 16.36 | 10.28 | 8.39 | 8 | 5.65 | 5.82 | 0 | 0 | 5.32 |
| Long-Term Investments | 12.45 | 12.36 | 12.27 | 12.25 | 14.41 | 3.74 | 3.52 | 3.55 | 4.66 | 4.06 | 11.08 | 3.84 | 2.02 | 0 | 0 | 0.59 |
| Goodwill and Intangibles | 4.64 | 4.66 | 4.68 | 4.57 | 4.58 | 4.59 | 4.6 | 4.61 | 4.62 | 4.63 | 0.31 | 0.32 | 0.33 | 0 | 0 | 0.36 |
| Other Long-Term Assets | 4.22 | 4.08 | 4.05 | 3.34 | 3.49 | 3.19 | 3.08 | 2.09 | 1.44 | 1.03 | 1.02 | 1.09 | 0.81 | 176.76 | 0.07 | 0.81 |
| Total Long-Term Assets | 45.59 | 44.98 | 49.7 | 51.64 | 56.85 | 37.28 | 30.71 | 26.6 | 21 | 18.11 | 20.41 | 10.9 | 8.97 | 176.76 | 0.07 | 7.07 |
| Total Assets | 154.08 | 108.95 | 99.73 | 106.79 | 138.48 | 97.74 | 126.86 | 169.18 | 190.08 | 109.85 | 127.8 | 138.26 | 22.29 | 177.52 | 0.08 | 13.06 |
| Accounts Payable | 16.53 | 15.4 | 34.95 | 34.67 | 37.08 | 29.09 | 13.2 | 13.73 | 14.68 | 15.16 | 20.18 | 5.9 | 15.45 | 0.05 | 0.04 | 8.18 |
| Deferred Revenue | 0 | 0 | 0 | 0 | 0 | 0 | 0 | 0 | 1.2 | 1.34 | 0.83 | 0 | 0 | 0 | 0 | 0 |
| Current Debt | 4.51 | 4.34 | 12.37 | 6.67 | 3.89 | 14.95 | 7.57 | 7.65 | 6.51 | 6.09 | 1.19 | 0.92 | 109.28 | 0 | 0.05 | 76.57 |
| Other Current Liabilities | 25.74 | 23.3 | 18.37 | 19.24 | 14.87 | 15.58 | 13.02 | 8.53 | -1.5 | 2.03 | 0 | 6.77 | 6.49 | 0.03 | 0 | 1.98 |
| Total Current Liabilities | 46.78 | 43.04 | 65.69 | 60.58 | 55.84 | 59.62 | 33.8 | 29.92 | 20.88 | 24.62 | 22.19 | 13.59 | 131.22 | 0.08 | 0.09 | 86.73 |
| Long-Term Debt | 207.52 | 233.33 | 202.39 | 174.4 | 165.12 | 94.9 | 100.2 | 105.87 | 106.84 | 13.54 | 0.11 | 0.43 | 0.5 | 0 | 0 | 0.02 |
| Other Long-Term Liabilities | 28.1 | 62.12 | 7.25 | 4.52 | 5.86 | 1.05 | 3.08 | 0.94 | 3.93 | 3.13 | 3.7 | 3.47 | 0.75 | 0 | 0 | 0.66 |
| Total Long-Term Liabilities | 235.63 | 295.45 | 209.64 | 178.92 | 170.98 | 95.95 | 103.28 | 106.81 | 110.77 | 16.67 | 3.8 | 3.89 | 1.25 | 0 | 0 | 0.68 |
| Total Liabilities | 282.41 | 338.49 | 275.32 | 239.5 | 226.82 | 155.57 | 137.08 | 136.73 | 131.66 | 41.29 | 25.99 | 17.48 | 132.47 | 0.08 | 0.09 | 87.41 |
| Total Debt | 212.03 | 237.67 | 214.76 | 181.07 | 169.01 | 109.85 | 107.77 | 113.52 | 113.35 | 19.63 | 1.29 | 1.35 | 109.78 | 0 | 0.05 | 76.59 |
| Debt Growth | 25.46% | 116.36% | 99.28% | 59.50% | 49.10% | 459.59% | 8234.80% | 8302.81% | 3.25% | – | 2486.00% | -98.24% | – | – | – | – |
| Common Stock | 706.3 | 620.02 | 542.34 | 513.62 | 501.38 | 461.17 | 452.1 | 448.97 | 444.35 | 436.38 | 415.57 | 413.1 | 20.62 | 5.09 | 0 | 20.35 |
| Retained Earnings | -834.64 | -849.57 | -717.94 | -646.34 | -589.73 | -519.01 | -462.32 | -416.53 | -385.93 | -367.81 | -313.77 | -292.31 | -249.42 | -0.09 | -0 | -204.07 |
| Comprehensive Income | 0 | 0.01 | 0.01 | 0.01 | 0 | 0.01 | 0 | 0 | 0 | 0 | 0 | 0 | 0 | 0 | 0 | 0 |
| Shareholders’ Equity | -128.33 | -229.54 | -175.6 | -132.71 | -88.34 | -57.83 | -10.22 | 32.45 | 58.42 | 68.57 | 101.81 | 120.79 | -228.8 | 5 | -0 | -183.72 |
| Net Cash / Debt | -150.56 | -211.01 | -195.86 | -161.23 | -128.58 | -92.21 | -51.05 | -7.73 | 31.46 | 55.13 | 99.46 | 120.5 | -103.24 | 177.26 | -0.04 | -75.73 |
| Net Cash / Debt Growth | – | – | – | – | – | – | – | – | – | -68.90% | – | – | – | – | – | – |
| Net Cash Per Share | -0.96 | -1.80 | -2.26 | -2.58 | -2.04 | -1.65 | -0.95 | -0.14 | 0.59 | 1.06 | 1.95 | 12.81 | -26.27 | 45.10 | -0.01 | – |
| Working Capital | 61.71 | 20.93 | -15.66 | -5.43 | 25.79 | 0.84 | 62.36 | 112.66 | 148.19 | 67.12 | 85.2 | 113.78 | -117.9 | 0.68 | -0.07 | -80.75 |
| Book Value Per Share | -0.93 | -1.96 | -2.02 | -2.13 | -1.40 | -1.03 | -0.19 | 0.60 | 1.09 | 1.32 | 1.99 | 12.84 | -58.21 | 1.27 | – | -46.74 |
Source: Nasdaq Data Link